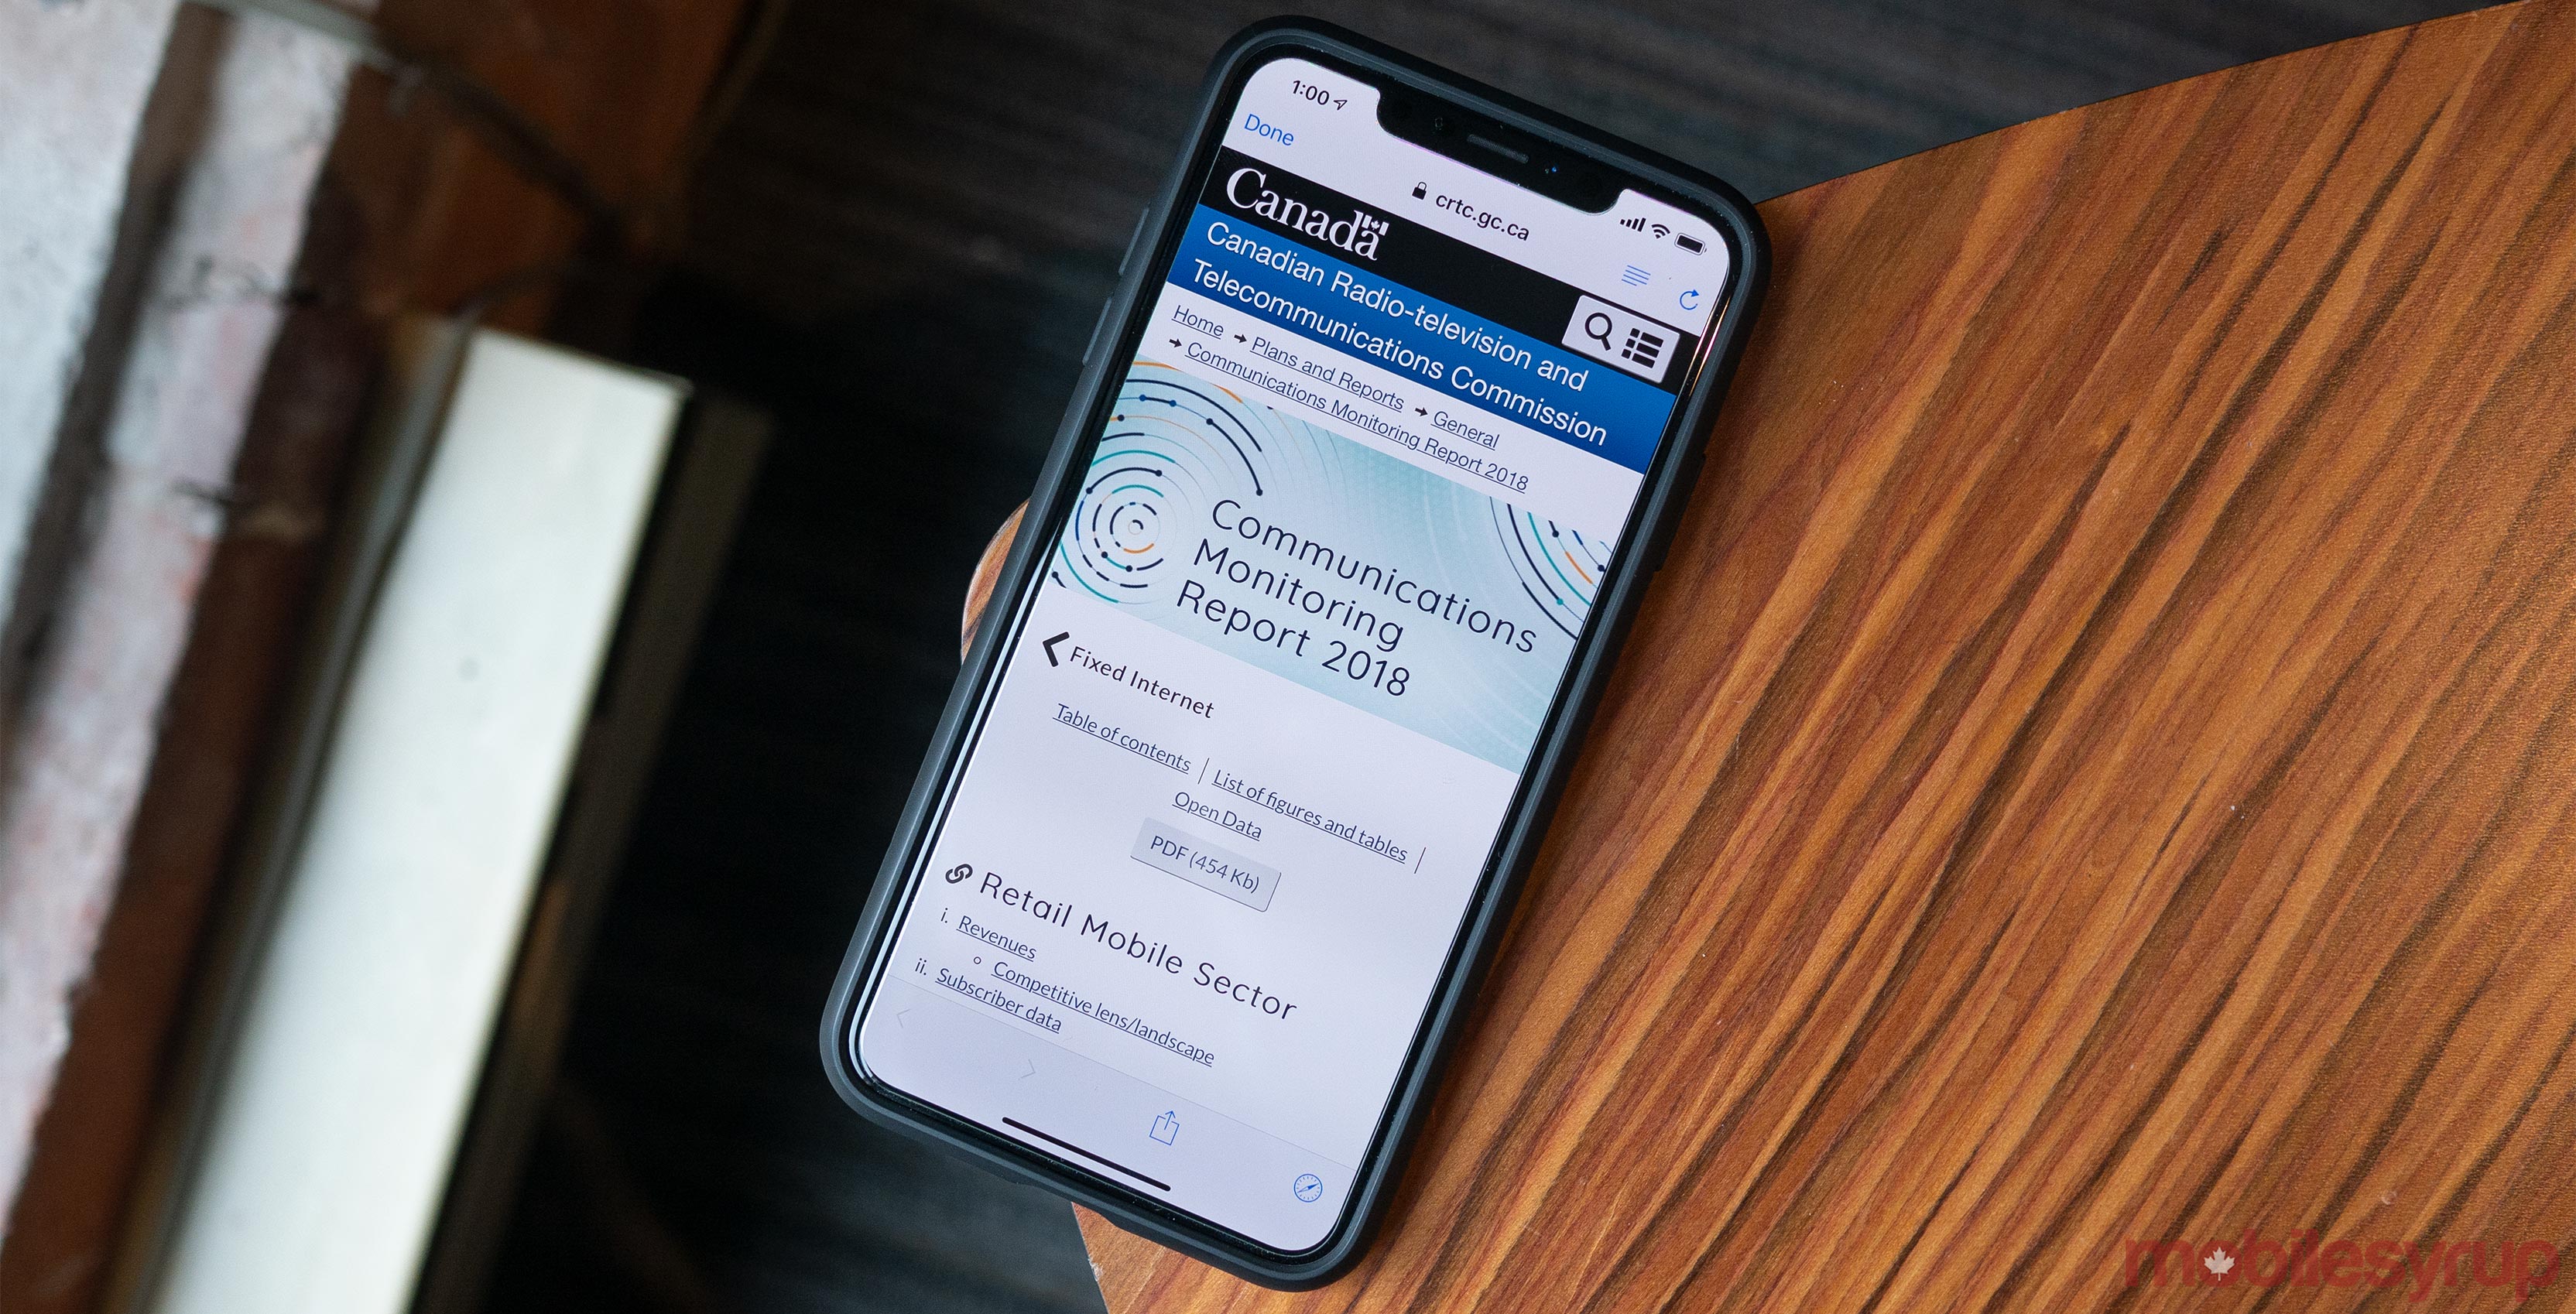
Canadian mobile revenues totalled $24.5 billion CAD in 2017, according to the Canadian Radio-television and Telecommunications Commission’s (CRTC) latest report.
As per the CRTC’s 2018 Communications Monitoring Report, Canadian mobile revenues increased by 5.3 percent compared to 2016.
The $24.5 billion figure reportedly represented 52 percent of all retail telecommunications revenues in 2017.
Additionally, the CRTC logged 31.7 million mobile subscribers in 2017, an increase of 3.1 percent compared to 2016.
As of January 1st, 2018, Statistics Canada estimated the country’s population had reached 36,963,854 people.
According to the CRTC’s latest report, average revenue per user (ARPU) in 2017 was $65.33 — a 2.1 increase compared to 2016.
Alberta had the highest ARPU — $73.60 — while Quebec had the lowest — $56.07.
The average revenue generated per 1GB of data used per month was $16.80.
The CRTC also reported that 78 percent of Canadians aged 18-or-older had a smartphone, nine percent had a regular cell phone specifically, while 57 percent owned a tablet.
In terms of the language breakdown, 79 percent of Anglophones had a smartphone, compared to 75 percent of Francophones.
Alberta is the province with the greatest percentage of smartphone users — 84 percent of the province had a smartphone in 2017.
Quebec had the smallest percentage of smartphone users. Only 75 percent of Quebecers have a smartphone.
The Big Three remain dominant
The top three mobile service providers in 2017, in terms of overall revenue and subscribers, were Bell, Rogers and Telus.
Canada’s so-called Big Three wireless service providers generated 92 percent of 2017’s total revenue, meaning that other providers accounted for eight percent of the country’s revenue market share.
The Big Three also claimed 90 percent of the mobile subscriber market, compared to the 10 percent claimed by other providers.
According to the CRTC, 100 percent of mobile subscribers in British Columbia, Alberta, Manitoba, New Brunswick, Nova Scotia, Prince Edward Island are signed up with the Big Three.
This figure seems odd, considering that Freedom Mobile, Canada’s fourth-largest wireless carrier, operates in British Columbia and Alberta. However, the CRTC’s figures exclude Freedom Mobile and Eastlink figures.
The Big Three’s LTE networks reportedly covered 98.5 percent of the population in 2017.
The country’s top three flanker brands — Rogers’ Fido Mobile, Telus’s Koodo Mobile and Bell’s Virgin Mobile — held approximately 27 percent of the country’s total subscriber-share in 2017.
Mobile data revenue is on the rise, long distance revenue is dropping
Mobile data revenues increased to 48.3 in 2017, a 7.8 percent increase in 2016.
Additionally, average data use across increased to 1.6GB-per-month across the country, representing a 37.5 percent increase compared to 2016.
The Big Three’s subscribers use an average of 1.6GB-per-month, while individuals subscribed to other providers use an average of 2.2GB-per-month.
Postpaid plans accounted for 95.5 percent of 2017’s wireless revenues, and 88 percent of subscribers were signed up to a postpaid plan.
It’s worth noting that data services accounted for the highest percentage of wireless revenue: 48 percent, or $11.8 billion.
Basic voice services accounted for the second-highest percentage: 38 percent or $9.2 billion.
Long distance revenues dropped to two percent in 2017, compared to six percent in 2013.
Of 2017’s voice roaming revenues, the greatest percentage of revenues (70 percent) were generated by subscribers roaming in the U.S.
Subscribers roaming internationally generated 28 percent of 2017’s total voice roaming revenues.
In terms of data roaming, 61 percent of revenues were generated by subscribers accessing data in the U.S., while 35 percent was generated by subscribers roaming internationally.
Canadian voice roaming charges accounted for two percent of the year’s voice roaming revenues, while Canadian data roaming charges accounted for three percent of the year’s data roaming revenues.
Canadian network distribution continues to grow
In addition to reporting figures about earnings and revenue, the CRTC’s latest report also found that approximately 92 percent of Canadians had access to advanced LTE (LTE-A) networks.
The LTE-A figure increased from 83 percent in 2016. Alberta had the highest LTE-A population coverage in 2017: 97.2 percent.
Other than the Canadian North, Saskatchewan had the lowest LTE-A population coverage: 48.1 percent.
Approximately 54 percent of Canadians had access to networks maintained by three providers.
PEI had the highest percentage of its population covered by thee or more networks: 95 percent.
Additionally, LTE networks — regular LTE and LTE-A — covered 99 percent of the population, as well as 86 percent of major roads and highways, in 2017.
The CRTC said that almost 16,000 kilometres across the country weren’t covered by LTE in 2017.
Approximately 83 percent of subscribers were signed up for a plan that included some amount of data.
The so-called average mobile data subscriber also reportedly used more than 2GB of data per month, a 30 percent increase compared to 2016.
Approximately 26 percent of all data subscribers had a plan with 1GB to 2GB of data
Approximately 31 percent of data subscribers had a plan with 5GB of data or greater.
Approximately 62 percent of subscribers had a plan with unlimited voice minutes.
Approximately 99 percent of mobile subscribers had a plan with unlimited text messaging.
Despite the CRTC’s implementation of the Wireless Code in 2013, subscribers signed up for a one-year or two-year contract increased to 49 percent in 2017, compared to 45 percent in 2016.
In terms of free Wi-Fi hotspots, British Columbia had the greatest number overall: 15,716.
Alberta came in second place, with 9,730 free Wi-Fi hotspots.
Source: CRTC
MobileSyrup may earn a commission from purchases made via our links, which helps fund the journalism we provide free on our website. These links do not influence our editorial content. Support us here.


